
A1Microsoft Fabric / Power BI accelerator
Sales Analytics Accelerator
See exactly why revenue and margin moved.
Understand trends and profitability with ease. PVM walks for revenue and PVCM for gross margin give you clear insight into sales performance, and planning and forecasting through Inforiver add quota attainment analysis.
0capabilities out of the box
PVM & PVCMwalks for revenue and margin
Inforiverplanning and forecasting built in
Liveinteractive, no sign-in needed
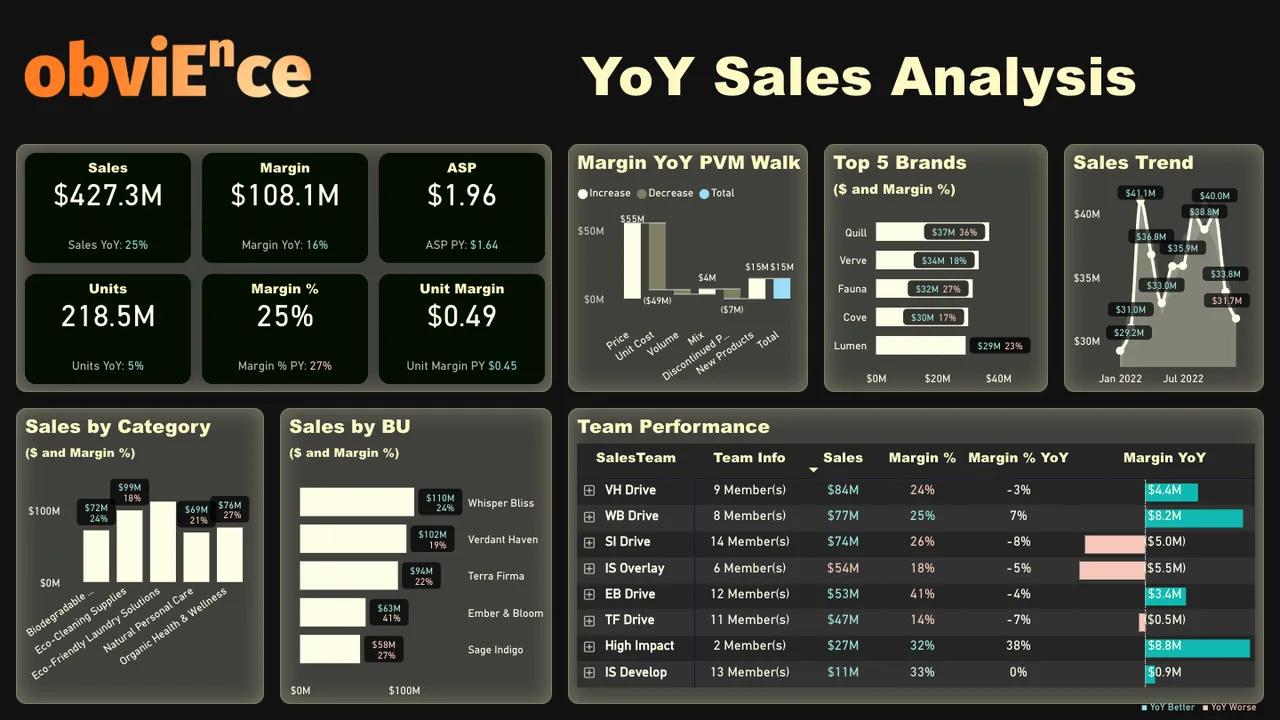
- Click any visual to cross-filter the page
- Hover a point for exact values
- Go full screen for the best view
A1Out of the box
Everything you see, ready on day one.
Built on Power BI and Microsoft Fabric for rapid deployment and quick time to value, then tailored to how you run the business.
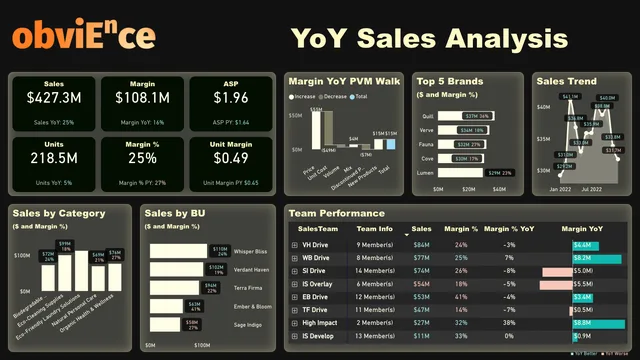 Sales strategy formulation analysis
- PVM walk for revenue
- PVM(C) walk for gross margin
- Constant currency analysis
- Exchange rate impact
- Pricing analytics
- Raw materials impact
- Inflation impact
- Quota planning and attainment analysis
- Sales planning, budgeting and forecasting
How it works
From your data to this dashboard.
- 1
Connect your data
We map your sources into the accelerator's model on Microsoft Fabric.
- 2
Deploy the accelerator
The model, the measures and the views arrive working, not as a blank canvas.
- 3
Make it yours
We tailor the views and KPIs to how you run the business, and hand it over.