
A4Microsoft Fabric / Power BI accelerator
IT Spend Accelerator
Every IT dollar, against plan.
Detailed insight into IT expenditure: variance to plan, spend by region and country, cost elements and business areas, so you can track and manage the IT budget with confidence.
0capabilities out of the box
Varianceto plan, month by month
Spendby region, country and area
Liveinteractive, no sign-in needed
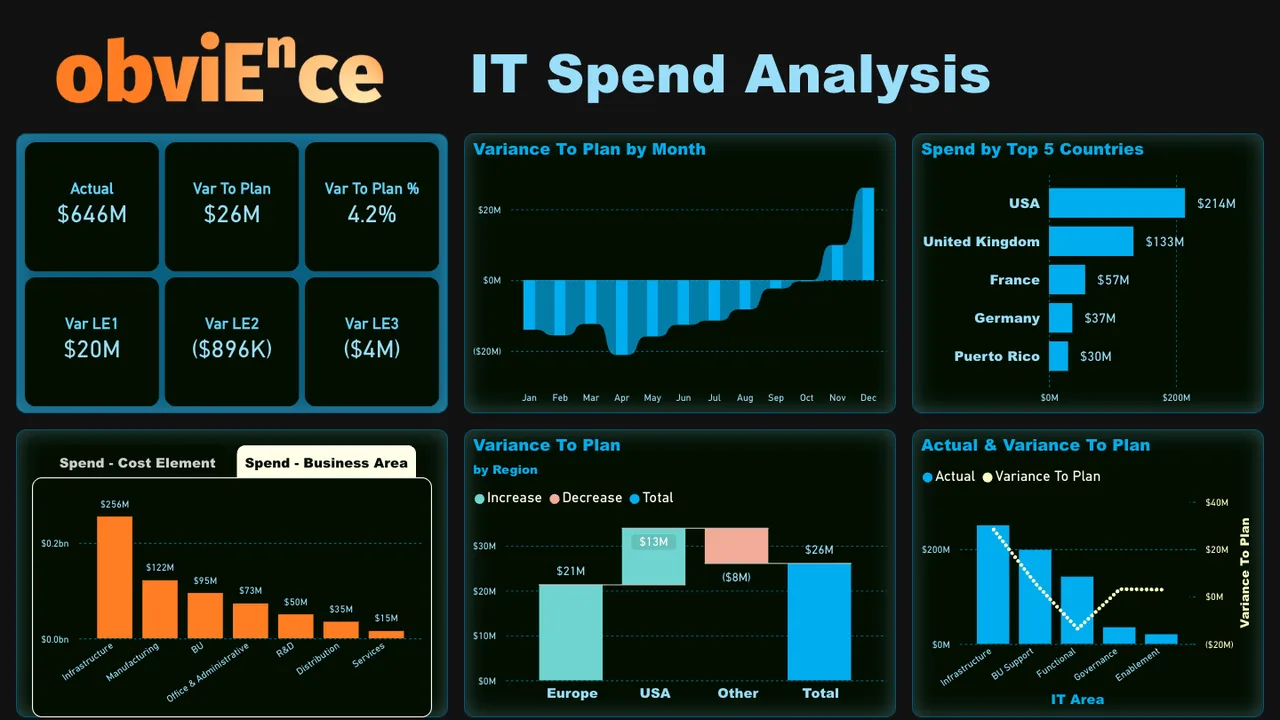
- Click any visual to cross-filter the page
- Hover a point for exact values
- Go full screen for the best view
A4Out of the box
Everything you see, ready on day one.
Built on Power BI and Microsoft Fabric for rapid deployment and quick time to value, then tailored to how you run the business.
 Variance to plan analysis
- Spend by region and country
- Cost element breakdown
- Business area spend analysis
- Monthly variance tracking
- Top country spend insights
- IT area actual and variance to plan
- Real-time dashboards
- Customisable KPIs and metrics
- Predictive analytics for IT spend
- Rapid deployment with Power BI and Microsoft Fabric
How it works
From your data to this dashboard.
- 1
Connect your data
We map your sources into the accelerator's model on Microsoft Fabric.
- 2
Deploy the accelerator
The model, the measures and the views arrive working, not as a blank canvas.
- 3
Make it yours
We tailor the views and KPIs to how you run the business, and hand it over.